Price
The current price of one code
Total Revenue
Est. lifetime revenue generated via AppSumo
Total Purchases
Number of times purchased
Deal Duration
How long the deal was available
Question Answer Rate
Percentage of questions answered
Question Avg Response Time
On average, developer answered questions within

Analyzing data without coding can feel like you’re searching for a specific recipe with no Internet access. (“How did we ever live like this?”)
But you don’t have time to learn how to write complex code just to get crucial insights from your database.
Luckily, there’s a tool that makes data analytics easy, so you can start exploring and sharing analytics—no matter your skill level.
Introducing Draxlr.
TLDR;
- Monitor, explore, and manage SQL data with custom dashboards—no coding required
- Alternative to: Trevor.io and Metabase
- Build data queries and visualize data as pie charts, bar graphs, and line graphs
- Best for: Website owners and analytics teams that want a convenient way to access and manage deeper insights from their database
At a Glance
Integrations
- Slack
Features
- GDPR-compliant
Detailed Description
Draxlr is a data analytics tool that helps you deep dive into SQL data insights as you scale—all without coding.
Draxlr lets you explore SQL data and get useful insights without any code for an informed and simple decision-making process.
Connect to your favorite database to start building queries and organizing your data right away.
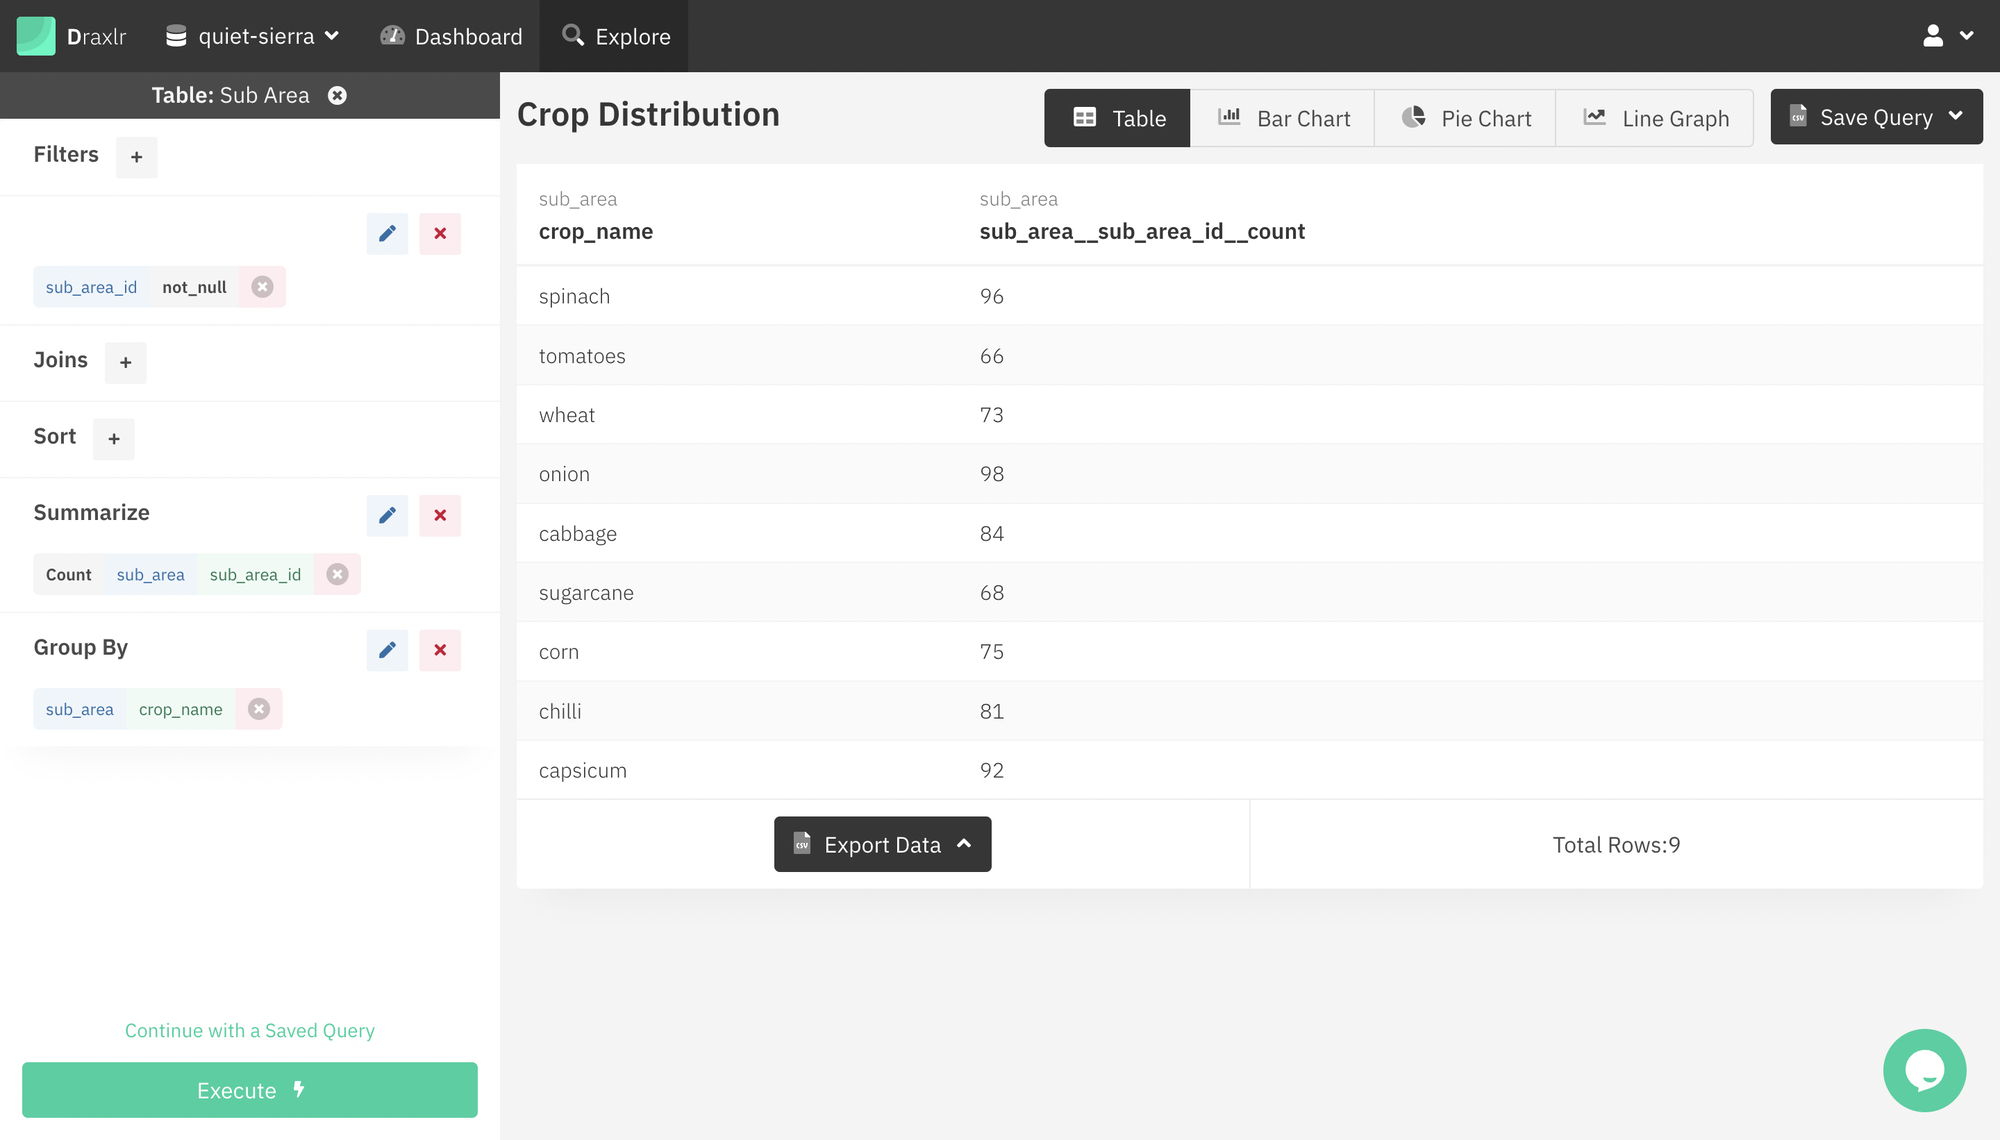
Using Draxlr’s SQL code editor, you can write raw queries and conveniently switch to Draxlr’s user-friendly query builder anytime.
You’ll be able to save your SQL data to build on later, or export it in Excel and CSV formats.

Explore, sort, and export SQL data with an easy-to-use query builder!
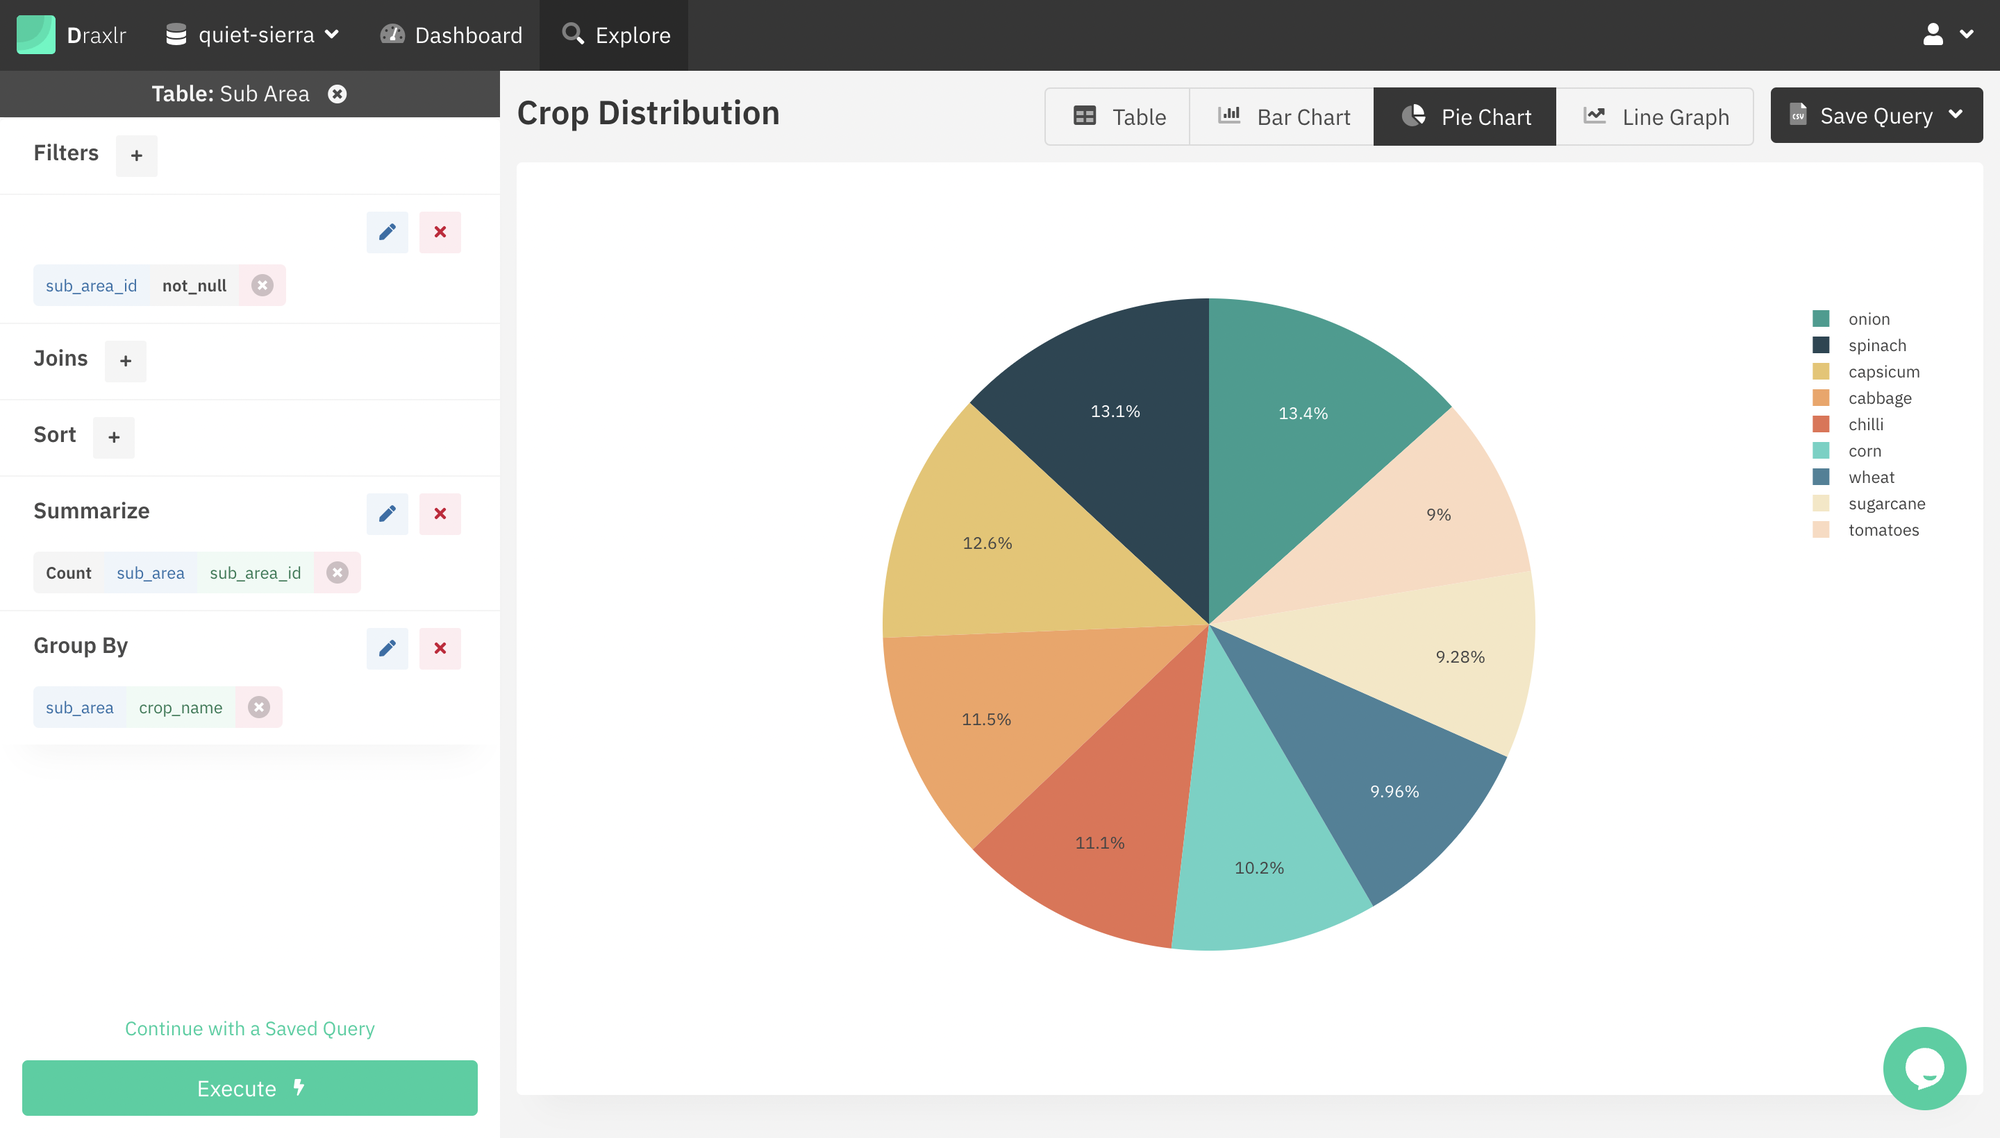
Draxlr gives you a clear view of your data with interactive visualizations that spotlight trends and outliers.
In just a click, you can convert query results into whatever visualization best fits your use case, including pie charts, bar graphs, and line graphs.
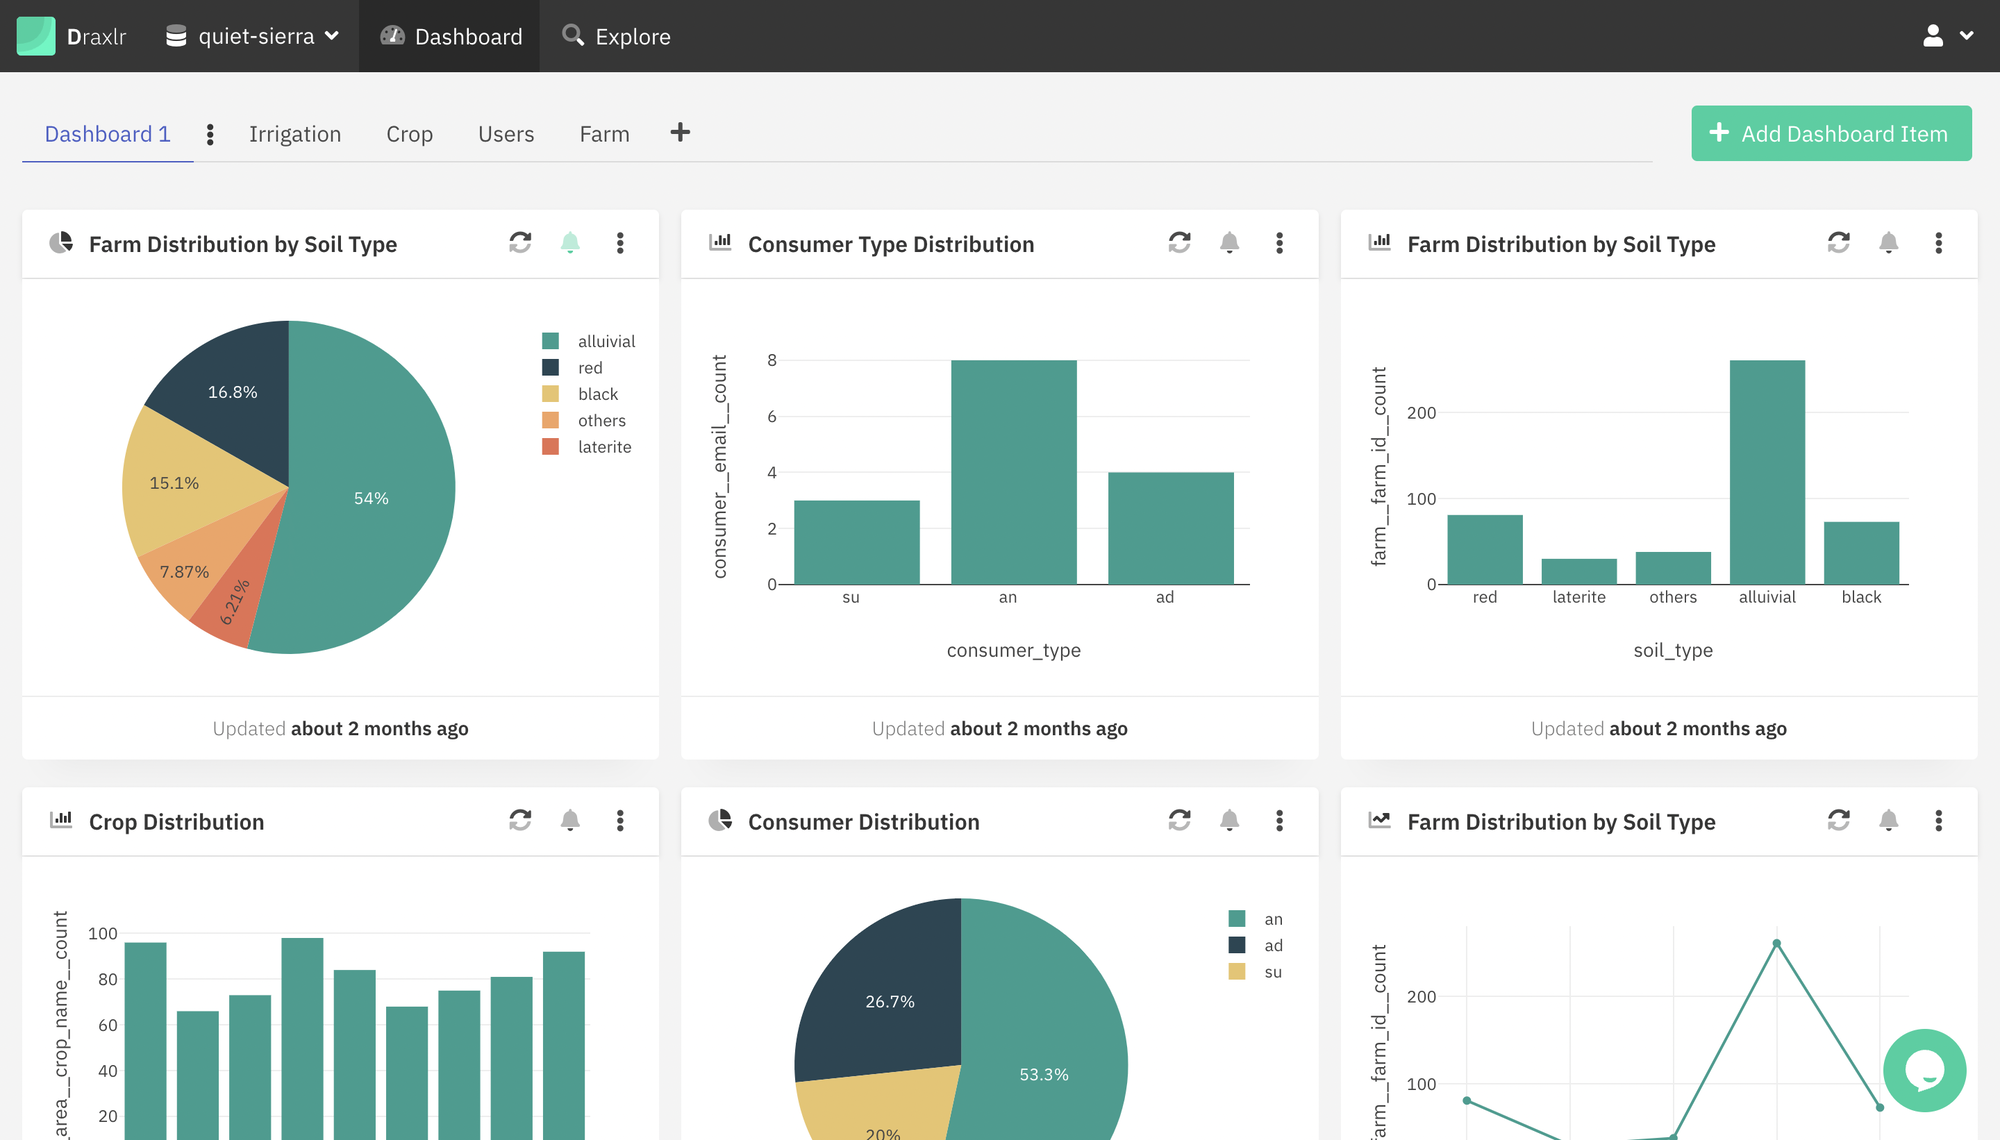
You can stick these data-rich visuals on dashboards for quick access to key metrics, so you’re always on top of what’s going on with your business.
Plus, you can instantly download any of your visualizations as a PNG file thanks to the snapshot tool.

Convert data query results into interactive visualizations, like pie charts and line graphs.
Draxlr also lets you build multiple dashboards, so you can keep data management efficient between departments and projects.
Update dashboard elements as needed, with the option to edit labels, visuals, refresh intervals, and queries.
You’ll also be able to share dashboard elements via URL, CSV files, downloadable images, or by embedding them directly on your website or application.
Best of all, Draxlr grows with your business. As you scale, you can build on top of saved queries.

Build multiple custom dashboards for your data visualizations and share dashboard elements.
Thanks to the automated data monitoring feature, you’ll stay updated on the evolution of your data.
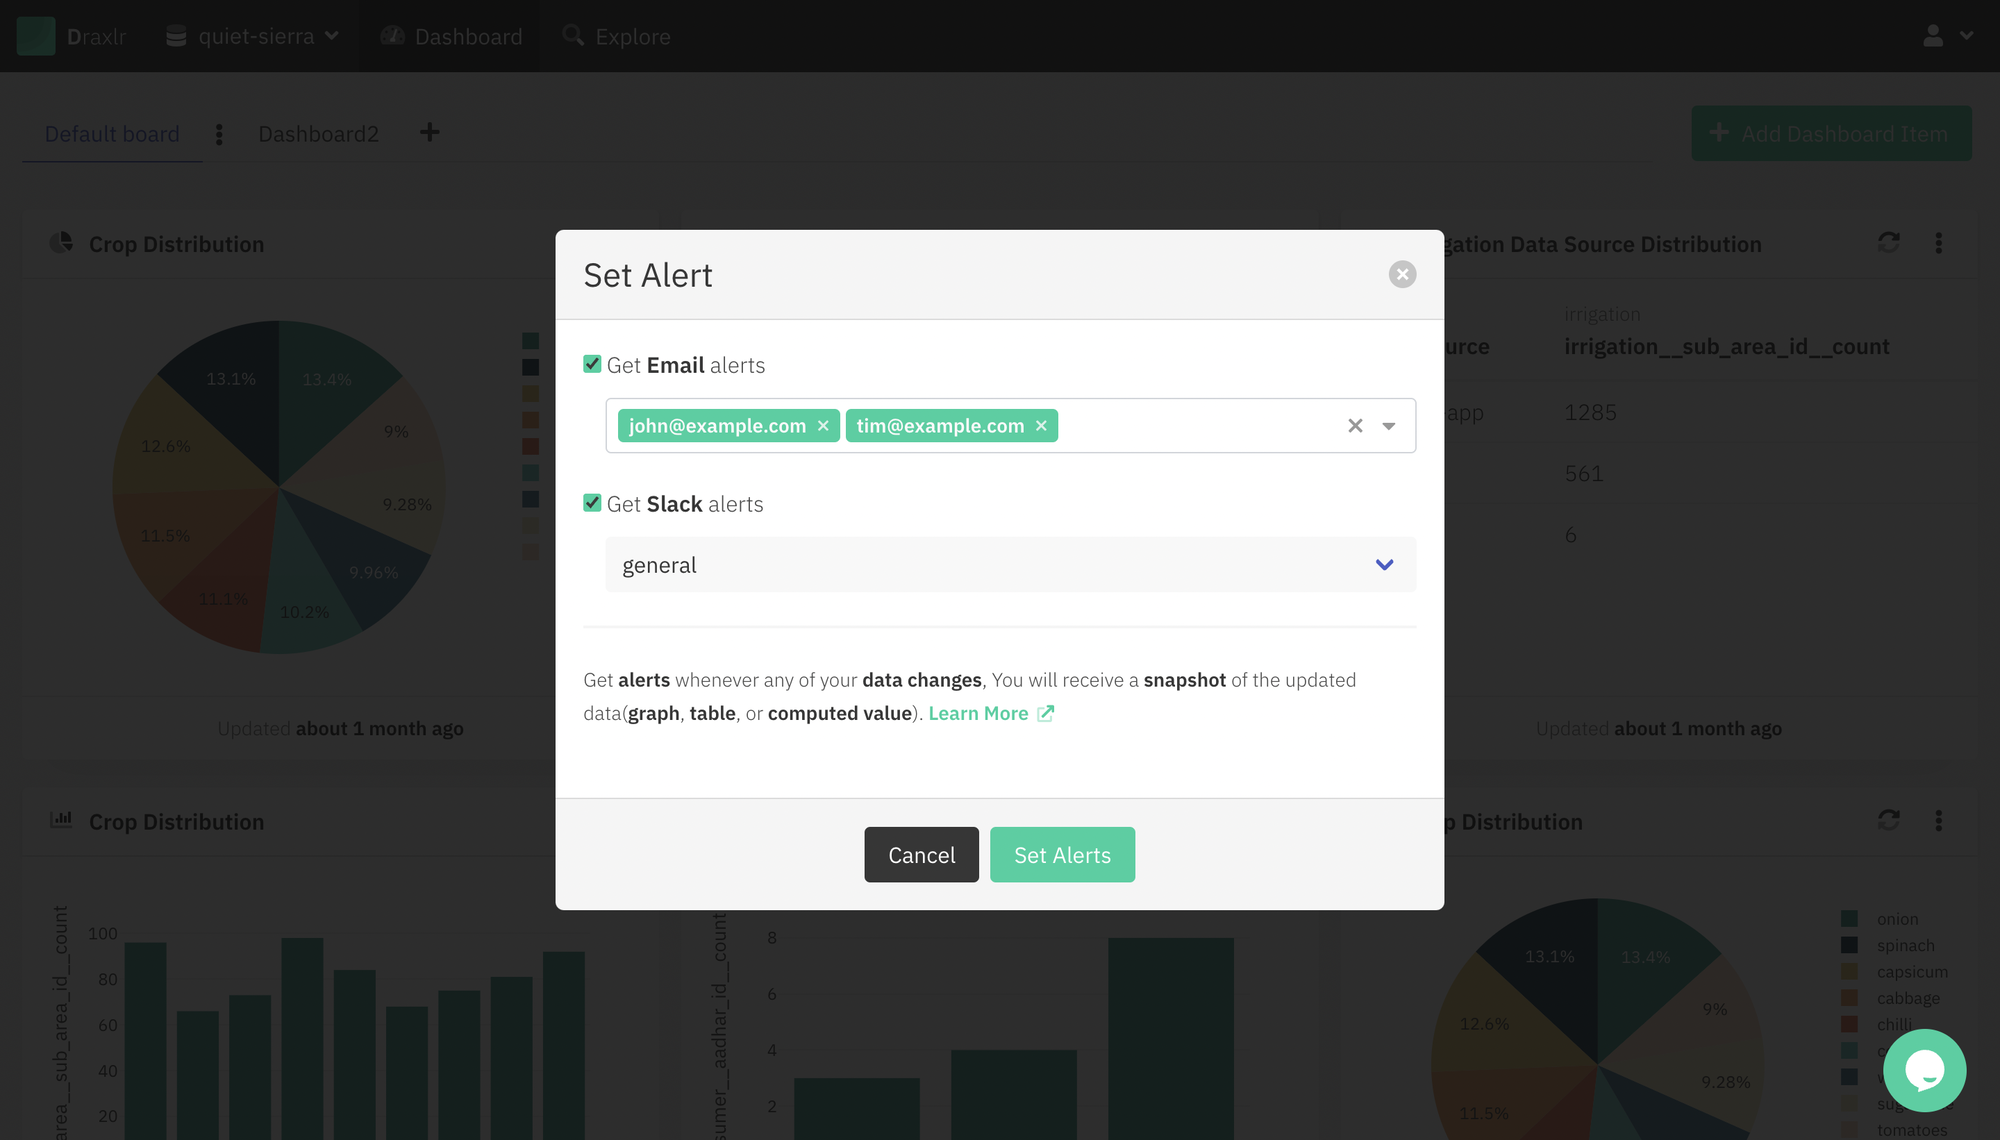
Draxlr lets you set periodic alerts on dashboard items, so you’re notified of every data change via Slack or email.
You can also finetune notifications to your use case, like getting separate emails for different dashboard elements.
By connecting to Slack, you can receive data change notifications as screenshots on Slack channels.

Set up alerts to get notified of any data changes via Slack or email.
Figuring out how to analyze your data shouldn’t feel like you’re putting together a 1000-piece puzzle in the dark. (“At least we aren’t missing any pieces…right?”)
Draxlr offers intuitive tools that make it easy to analyze and monitor your data, without the need for coding skills or a dedicated team of experts.
Understand the data that powers your business.
Get lifetime access to Draxlr today!
